

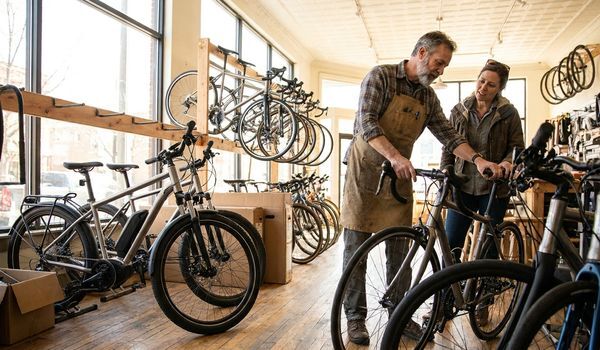
Bicycle shop statistics tell a detailed story about where the cycling retail industry stands in 2026 and where it is heading. Whether you own a single neighborhood bike shop, run a multi-location retail operation, or are considering opening your first store, understanding the latest industry data helps you make smarter decisions about inventory, staffing, pricing, and growth. This guide brings together the most important bicycle industry statistics for 2026, covering market size, shop counts, revenue benchmarks, e-bike growth, consumer behavior, and the trends shaping the year ahead.
In This Article
- The State of the Bicycle Retail Industry in 2026
- Key Bicycle Shop Statistics at a Glance
- How Many Bicycle Shops Are in the US?
- Bicycle Shop Revenue and Sales Statistics
- E-Bike Statistics: The Fastest Growing Segment
- Bicycle Shop Industry Trends Shaping 2026
- Consumer Demographics and Buying Behavior
- Challenges Facing Bicycle Shop Owners
- How Crestmont Capital Helps Bicycle Shop Owners
- Real-World Scenarios
- Frequently Asked Questions
- Next Steps
The State of the Bicycle Retail Industry in 2026
The bicycle industry has been through a dramatic cycle over the past six years. The pandemic triggered one of the largest demand surges in the history of the sport, as millions of Americans rediscovered cycling for exercise, commuting, and family recreation. Retailers sold out of inventory, manufacturers raced to catch up, and new riders entered the market at record rates. What followed was an equally sharp normalization: by 2023 and 2024, shops faced excess inventory, heavy discounting, and softer foot traffic as demand settled back toward pre-pandemic patterns.
In 2026, the industry has largely stabilized. The US bicycle market is estimated at roughly $9.5 to $10 billion annually when you combine bicycles, parts, accessories, and service. Independent bicycle dealers remain the backbone of the specialty retail channel, even as e-commerce and direct-to-consumer brands take a larger share of unit sales. What separates the shops that are thriving from those that are struggling is no longer foot traffic alone. It is the ability to blend retail sales with high-margin service work, e-bike expertise, fitting services, and community building.
For shop owners, the data below matters for practical reasons. Market size figures tell you whether the pie is growing. Shop count data tells you how much competition you face. Revenue benchmarks tell you how your store compares to peers. E-bike statistics point to where the margin opportunity is. And consumer behavior data tells you how to stock, staff, and market your business this year.
Key Bicycle Shop Statistics at a Glance
Here are the headline numbers every bike shop owner should know going into 2026:
Industry Snapshot
Bicycle Shop Statistics 2026 - At a Glance
$9.7B
Estimated US bicycle market size
~6,000
Independent bicycle retailers in the US
1M+
E-bikes sold annually in the US
$500K
Typical revenue range midpoint for an established shop
Each of these numbers comes with important context. The sections below break down what they mean and how to use them.
How Many Bicycle Shops Are in the US?
One of the most common questions in bicycle industry statistics is how many bike shops actually operate in the United States. The answer depends on how you count. The National Bicycle Dealers Association (NBDA) estimates there are roughly 6,000 independent bicycle dealers in the country, down from peaks above 7,000 in earlier decades. When you broaden the lens to include all sporting goods stores that sell bicycles, the Census Bureau's County Business Patterns data shows a much larger footprint under NAICS code 451110 (Sporting Goods Stores), but the specialty channel of dedicated bike shops is the figure that matters most for independent retailers.
Several forces have driven the long, slow consolidation in shop counts:
- E-commerce pressure. Online retailers and direct-to-consumer bike brands have captured a growing share of unit sales, particularly at the entry level and mid-range price points.
- Rising operating costs. Rent, labor, insurance, and inventory carrying costs have all climbed faster than bike prices in many markets, squeezing shops that rely on high volume and thin margins.
- Owner retirements. A significant share of independent bike shops are owned by operators who founded them in the 1970s, 1980s, or 1990s. As those owners retire, some shops sell, some convert to new ownership, and some simply close.
- Pandemic whiplash. The 2020 to 2021 boom masked underlying weakness for some stores. When demand normalized, shops that had over-expanded or over-ordered faced difficult years in 2023 and 2024.
At the same time, new shop openings have not stopped. E-bike specialty stores, mobile repair operations, and service-focused shops with small retail footprints have emerged as viable formats with lower startup costs than a traditional full-line store. The net result is an industry that is consolidating in count but diversifying in format.
For a current or prospective shop owner, the practical takeaway is this: local competition is thinner than it was a decade ago in most markets, but the competition you do face is more sophisticated. Shops that survive tend to run disciplined inventory, treat the service department as a profit center rather than a courtesy, and maintain strong community ties through group rides, clinics, and local advocacy.
Bicycle Shop Revenue and Sales Statistics
Revenue benchmarks are where bicycle shop statistics get personal. How does your store compare to the rest of the industry? Industry surveys and cost-of-doing-business studies over the years point to a few consistent patterns.
The typical independent bike shop in the US generates annual revenue somewhere between $400,000 and $1 million, with the midpoint for an established, professionally run store often landing near $500,000 to $700,000. Top-performing shops in strong markets exceed $2 million, while small-town or highly seasonal stores may operate below $300,000. New shops commonly take three to five years to reach steady-state revenue.
Revenue mix matters as much as revenue size:
- Bicycle sales typically account for 50 to 60 percent of revenue but carry the lowest margins, often in the 30 to 36 percent gross margin range, and lower on heavily discounted models.
- Parts and accessories usually contribute 15 to 25 percent of revenue at healthier margins, often 40 to 50 percent.
- Service and repair contributes 10 to 20 percent of revenue at many shops but delivers the strongest margins, frequently 60 percent or more on labor. Service is also the most defensible revenue stream because it cannot be fulfilled by an online warehouse.
- E-bike sales have become a meaningful revenue driver disproportionate to their unit share because of higher average selling prices, often $2,500 to $5,000 per unit compared to $600 to $1,200 for a conventional bike.
Key Insight
A shop generating $600,000 in revenue with a strong service department can be more profitable than a shop generating $900,000 that relies almost entirely on discounted bike sales. Revenue mix, not just revenue size, determines whether the numbers work.
Seasonality is another defining feature of bike shop revenue. Most shops generate 60 to 70 percent of annual sales between April and September, with a secondary spike around the December holidays. That concentration creates a predictable cash flow challenge: inventory must be purchased in late winter and early spring, exactly when cash reserves are lowest after the slow season. This cycle is one of the main reasons shop owners use financing tools like a business line of credit to bridge the gap between buying season and selling season.
Ready to Stock Up for the Season?
Flexible funding for inventory, service expansion, or an e-bike program from the #1 business lender in the US.
Apply Now →E-Bike Statistics: The Fastest Growing Segment
No single category has reshaped bicycle industry statistics more than electric bikes. E-bike sales in the United States crossed the 1 million unit mark in the early 2020s, and industry reporting from outlets like Reuters has tracked their continued growth even as conventional bike sales cooled after the pandemic boom. In unit terms, e-bikes have grown several-fold since 2019, and in dollar terms their share of the market is even larger because of premium pricing.
For bike shop owners, the e-bike statistics that matter most are these:
- Higher average tickets. The average e-bike sells for $2,500 to $5,000 through the specialty channel, compared to well under $1,500 for most conventional bikes. A modest number of e-bike sales can move total revenue meaningfully.
- Service attachment. E-bikes require more frequent service than conventional bikes because of their weight, speed, and electrical components. Battery health checks, firmware updates, brake wear, and drivetrain wear all drive repeat visits.
- New customer demographics. E-bike buyers skew older and include many customers returning to cycling after years away, plus commuters replacing car trips. These customers often have higher household incomes and stronger willingness to pay for quality and service.
- Inventory capital requirements. The flip side of premium pricing is premium wholesale cost. A 20-unit e-bike floor plan can tie up $40,000 to $60,000 in inventory capital, which is why many shops finance their e-bike assortment rather than paying cash.
The strategic implication is straightforward. Shops that built credible e-bike programs early, with trained staff, demo fleets, and service capability, are capturing a disproportionate share of industry growth. Shops that treated e-bikes as a fad are now playing catch-up in a category where consumers strongly prefer expert guidance before a $3,000-plus purchase.
Bicycle Shop Industry Trends Shaping 2026
Beyond the headline numbers, several structural trends are defining how successful shops operate in 2026.
Service as the Anchor Revenue Stream
With bike margins compressed by online competition, the service department has become the financial anchor of the modern bike shop. Leading shops now treat service as a first-class business line with online booking, flat-rate menu pricing, turnaround time guarantees, and maintenance plan subscriptions. Some shops report that service revenue grew 20 to 30 percent between 2022 and 2025 even as bike unit sales softened, driven by the installed base of pandemic-era bikes now needing their first major overhauls.
Inventory Discipline After the Boom-Bust Cycle
The pandemic taught the industry an expensive lesson about inventory. Shops that ordered aggressively in 2021 and 2022 spent 2023 and 2024 discounting to clear aged stock. In 2026, the prevailing mindset is lean inventory, faster turns, and a willingness to special-order rather than stock deep. Preseason commitments to suppliers still matter, but they are sized conservatively compared to the boom years.
The Used Bike and Trade-In Opportunity
Certified pre-owned programs, trade-ins, and consignment sales have emerged as a meaningful trend. Used bikes attract price-sensitive customers who would otherwise buy online, and trade-in programs feed a pipeline of future upgrades. Some shops report used bikes delivering better margins than new bikes while also driving service traffic.
Community as a Competitive Moat
The shops that consistently outperform their markets tend to share one trait: they are community hubs, not just stores. Group rides, skills clinics, youth programs, charity events, and local trail advocacy create loyalty that no online retailer can match. Industry surveys have repeatedly found that customers who participate in shop events spend significantly more per year than customers who do not.
Smarter Use of Data
Modern point-of-sale systems give shop owners visibility into margin by category, inventory turn rates, service department efficiency, and customer lifetime value. The gap between shops that use this data and shops that run on instinct shows up directly in profitability. If you are not reviewing your numbers monthly, your competitors are.
Pro Tip
Track three numbers weekly: service department backlog in days, inventory turn rate, and average repair ticket. These three metrics predict cash flow problems months before they show up in your bank account.
Consumer Demographics and Buying Behavior
Understanding who buys bikes and how they shop is essential context for the revenue statistics above. The cycling customer base has diversified meaningfully over the past decade.
Key patterns in 2026 consumer behavior include:
- Research online, buy in store for premium purchases. Most customers research extensively online before visiting a shop, but for purchases above roughly $2,000, a large majority still prefer to buy from a physical store where they can test ride and get fitted. This is especially true for e-bikes.
- The entry-level customer is the hardest to keep. Sub-$800 bike purchases have migrated heavily online and to big-box channels. Many shops have consciously exited this segment and focused on enthusiast, family, and e-bike customers.
- Women represent a growing share of riders. Industry participation data shows steady growth in female ridership, and shops with strong women's product assortments and inclusive shop cultures report measurable revenue benefits.
- Service expectations have risen. Customers now expect online booking, text updates, transparent pricing, and fast turnaround. Shops that deliver a professional service experience win repeat business; shops with a chaotic back counter lose it.
- Local preference remains strong. Surveys consistently show that a majority of cyclists prefer to buy from a local shop when price and availability are comparable. The catch is that "comparable" now includes the convenience of online ordering, which is why many shops have added buy-online-pickup-in-store options.
For broader small business context, the SBA Office of Advocacy publishes regular data on small business formation, survival rates, and financing trends that complement industry-specific data, and the Census Bureau's County Business Patterns program provides establishment counts you can use to benchmark retail density in your own market.
Challenges Facing Bicycle Shop Owners
The statistics above paint a picture of an industry with real opportunity, but also real headwinds. Understanding the challenges is as important as understanding the growth areas.
Margin compression. Bike margins have compressed as online competition and direct-to-consumer brands reset consumer price expectations. Shops increasingly rely on service, accessories, and e-bikes to maintain blended margins.
Inventory capital strain. Carrying a competitive assortment requires substantial working capital. A mid-sized shop might carry $150,000 to $300,000 in inventory at cost, with a large share committed before the selling season begins. One weak season or one wrong bet on a product category can create a cash crunch that takes a year to unwind.
Seasonality. The spring-summer revenue concentration means shops must survive four to five slow months on the strength of seven good ones. Fixed costs do not take the winter off.
Labor. Experienced bike mechanics are scarce in most markets, and shops compete for them with better-paying trades. Training a mechanic from scratch takes one to two years of investment.
Supplier dynamics. The largest bike brands have shifted meaningful volume to their own direct channels, and dealer terms, territory protection, and inventory requirements vary widely. Shop owners need to manage supplier relationships as strategically as customer relationships.
Competition from outside the channel. Big-box retailers, online marketplaces, and direct-to-consumer brands collectively sell more bike units than the specialty channel. The specialty shop's answer is expertise, service, and community, but delivering those profitably requires operational discipline.
None of these challenges are new, and none are insurmountable. The shops that navigate them best share a common trait: they manage cash flow proactively instead of reactively, using financing strategically for inventory, expansion, and slow-season stability rather than waiting until a crunch forces the issue.
How Crestmont Capital Helps Bicycle Shop Owners
Crestmont Capital works with bicycle shop owners at every stage, from established multi-location retailers to first-time store owners. As the #1 rated business lender in the US, we structure financing around the realities of retail seasonality and inventory cycles, not against them.
Here is how shop owners typically use our programs:
- Inventory financing to fund preseason orders of bikes, e-bikes, parts, and accessories so you can stock deep for the selling season without draining cash reserves in the slow season.
- Business lines of credit to smooth the cash flow gap between buying season and selling season, covering payroll, rent, and operating costs during the winter months.
- Equipment financing for service department lifts, tools, fitting equipment, e-bike diagnostic systems, and delivery vehicles, preserving cash for inventory.
- Working capital loans for shop build-outs, second locations, service department expansions, and marketing pushes into new customer segments.
If you are evaluating the financial side of shop ownership, our bicycle shop business loans guide walks through financing options in detail, and our small business loan statistics post provides broader context on approval rates and funding trends across industries.
Fund Your Shop's Next Growth Phase
Inventory, equipment, expansion, or working capital - get a fast decision from a lender that understands retail.
Get Started →Real-World Scenarios: How Shops Use Industry Data and Financing
Statistics are only useful when they inform decisions. Here are six realistic scenarios showing how bike shop owners apply the numbers above.
Scenario 1: The preseason inventory crunch. A shop owner in Colorado reviews her numbers in February. Last season she turned away an estimated $80,000 in sales because she ran out of mid-range e-bikes by June. This year she wants to commit $120,000 to preseason e-bike inventory, but she only has $45,000 in cash after the slow winter. She uses inventory financing to fund the order, sells through 85 percent of it by August, and repays the facility from season revenue with room to spare.
Scenario 2: The service department expansion. A Midwest shop owner notices his service backlog stretching to three weeks during peak season. The data tells him he is losing service customers to a competitor. He finances a second service bay, two additional stands, and a dedicated e-bike diagnostic station, then hires a second mechanic. Service revenue grows 40 percent year over year, and the new bay pays for itself in fourteen months.
Scenario 3: The winter cash flow bridge. A shop in the Pacific Northwest generates 65 percent of its revenue between April and September. Every winter, the owner watches cash dwindle while rent, insurance, and key staff payroll continue. She opens a business line of credit, draws on it from November through February, and pays it down each spring. The line converts a stressful annual scramble into a routine, planned cycle.
Scenario 4: The e-bike pivot. A traditional road-bike shop owner sees e-bike sales growing in his market but has no credible assortment. He finances a 15-unit e-bike demo and inventory program plus mechanic training. Within a year, e-bikes represent 22 percent of unit sales but 38 percent of bike revenue, and the demo fleet generates a steady stream of test-ride appointments from customers who found the shop through e-bike searches.
Scenario 5: The second location. A successful suburban shop owner identifies an underserved market twenty miles away with strong trail access and no specialty retailer. Rather than draining the first store's reserves for the build-out, he finances the second location's fixtures, initial inventory, and six months of operating cushion. The new store reaches break-even in its second season.
Scenario 6: The acquisition. A longtime shop owner in a growing Sun Belt market announces his retirement. A younger manager at a competing store arranges financing to acquire the business, including its customer list, service reputation, and remaining inventory. The acquisition cost is recouped in under four years because the store's community goodwill transferred with the sale.
Frequently Asked Questions
How many bicycle shops are there in the United States? +
The National Bicycle Dealers Association estimates roughly 6,000 independent bicycle dealers operate in the US, down from peaks above 7,000 in earlier decades. The count has been slowly consolidating due to e-commerce pressure, owner retirements, and rising operating costs, though new formats like e-bike specialty stores and mobile repair operations continue to open.
What is the average revenue of a bike shop? +
A typical established independent bike shop generates between $400,000 and $1 million annually, with the midpoint often near $500,000 to $700,000. Top performers in strong markets exceed $2 million, while small or highly seasonal shops may operate below $300,000. New shops commonly take three to five years to reach steady-state revenue.
How big is the bicycle industry in the US? +
The US bicycle market is estimated at roughly $9.5 to $10 billion annually when combining bicycles, parts, accessories, and service. The market surged during the pandemic, normalized through 2023 and 2024, and has stabilized entering 2026 with e-bikes and service driving a growing share of total dollars.
Are bicycle shops profitable? +
Yes, when managed well. Net margins for well-run shops typically land in the 5 to 10 percent range, with the strongest performers exceeding that. Profitability depends heavily on revenue mix: shops with strong service departments and e-bike programs consistently outperform shops that rely primarily on discounted bike sales.
How much do e-bike sales contribute to bike shop revenue? +
At shops with developed e-bike programs, e-bikes commonly represent 20 to 30 percent of unit sales but 30 to 45 percent of bike revenue because average selling prices run $2,500 to $5,000. E-bikes also drive repeat service revenue since they require more frequent maintenance than conventional bikes.
What are the biggest challenges for bicycle shop owners? +
The most common challenges are margin compression from online competition, the working capital strain of carrying inventory through a long off-season, the scarcity of experienced mechanics, supplier terms as major brands grow direct channels, and the cash flow impact of seasonality, since most shops earn 60 to 70 percent of revenue between April and September.
How did the pandemic affect bicycle shop sales? +
The pandemic triggered a historic demand surge in 2020 and 2021, with many categories selling out and some segments growing 40 percent or more. The hangover arrived in 2022 through 2024 as demand normalized and shops worked through excess inventory at discounted prices. By 2026, the market has largely stabilized, and the pandemic-era installed base of bikes now drives a healthy service cycle.
What is the average profit margin for a bicycle shop? +
Gross margins vary by category: new bikes typically run 30 to 36 percent, parts and accessories 40 to 50 percent, and service labor 60 percent or more. After operating expenses, net margins for well-managed shops generally fall between 5 and 10 percent of revenue.
How many people do bike shops employ? +
A typical independent shop employs 4 to 10 people, including owner-operators, sales staff, and mechanics, with seasonal hiring in spring and summer. Across roughly 6,000 independent dealers, the specialty retail channel supports tens of thousands of jobs, plus additional employment in distribution, events, and advocacy.
What percentage of bikes are sold online versus in stores? +
Online and mass channels account for the majority of total bike units sold in the US, particularly at price points under $800. However, the specialty retail channel holds a much stronger position in premium bikes, e-bikes, and service. For purchases above $2,000, most buyers still prefer a physical shop for test rides, fitting, and after-sale support.
How much does it cost to start a bicycle shop? +
Startup costs for a traditional full-line bike shop typically range from $150,000 to $400,000 or more, covering initial inventory (often $100,000 to $200,000), leasehold improvements, fixtures, service equipment, and working capital. Leaner formats like service-focused shops, mobile repair, or e-bike specialty stores can launch for considerably less.
What are the best-selling bike categories? +
E-bikes lead dollar growth, particularly commuter, cargo, and e-mountain models. Gravel bikes have been the strongest conventional category in recent years, blending road and off-road versatility. Mountain bikes, hybrid and comfort bikes, and kids' bikes remain steady volume categories, while traditional road racing bikes have softened as rider preferences shift toward versatility.
How do bicycle shops compete with online retailers? +
Successful shops compete on what online sellers cannot deliver: professional fitting, test rides, same-day service, warranty support, and community. Many have also adopted the best online tactics themselves, including buy-online-pickup-in-store, online service booking, and active social media. The goal is not to out-discount the internet but to make the shop indispensable to local riders.
What financing options are available for bike shop owners? +
Common options include inventory financing for preseason orders, business lines of credit for seasonal cash flow, equipment financing for service bays and tools, working capital loans for expansion, and acquisition financing for buying an existing shop. Crestmont Capital structures these around retail seasonality, with fast approvals and terms designed for businesses that earn most of their revenue in part of the year.
Is the bicycle industry growing or shrinking? +
The industry is stable to modestly growing in dollar terms, with important shifts underneath. Conventional bike unit sales have softened from pandemic peaks, but e-bikes continue to grow, service revenue is expanding, and premium categories remain healthy. For shop owners, the opportunity in 2026 is less about riding a rising tide and more about capturing share through service, e-bikes, and community.
Put These Numbers to Work
Whether you are stocking up, expanding service, or opening a second location, Crestmont Capital can fund it fast.
Apply Now →Next Steps for Bicycle Shop Owners
Data only creates value when you act on it. Here is how to put this year's bicycle shop statistics to work in your business:
Compare your revenue, margin mix, and service percentage against the industry ranges above. Identify whether you are over-indexed on low-margin bike sales or under-invested in service.
If e-bikes are under 15 percent of your bike revenue, you are likely leaving the industry's strongest growth category to competitors. Evaluate your assortment, staff training, and demo program.
Plot your preseason inventory commitments against your slow-season cash position. If there is a gap, arrange financing before the squeeze arrives, not during it.
Complete a quick application at offers.crestmontcapital.com/apply-now and a Crestmont Capital advisor will review your options with you. There is no obligation, and most applicants receive a decision fast.
Conclusion
The bicycle shop statistics for 2026 describe an industry that has moved past the whiplash of the pandemic cycle and settled into a more disciplined, service-driven era. The US bicycle market remains a roughly $10 billion opportunity, supported by around 6,000 independent retailers, a growing e-bike category with premium price points, and an installed base of millions of pandemic-era bikes now feeding the service economy.
For shop owners, the path forward is clear even if it is not easy. Compete on expertise, service, and community rather than price. Manage inventory and cash flow with the discipline the boom-bust cycle taught. Invest where the data points: e-bikes, service capacity, and customer experience. And when the numbers show an opportunity that exceeds your cash on hand, whether that is a preseason inventory order, a service department expansion, or a second location, treat financing as the strategic tool it is rather than a last resort.
The shops that win in this environment are the ones that know their numbers. Now you know the industry's. The next move is yours.
Disclaimer: The information provided in this article is for general educational purposes only and is not financial, legal, or tax advice. Funding terms, qualifications, and product availability may vary and are subject to change without notice. Crestmont Capital does not guarantee approval, rates, or specific outcomes. For personalized information about your business funding options, contact our team directly.

About the author and reviewer
Allan GarfinkleMBA (Finance), JD
Chief Revenue Officer, Crestmont Capital
Allan Garfinkle is the Chief Revenue Officer at Crestmont Capital, where he has spent more than a decade leading revenue strategy, business development, and operational growth. With 28 years of experience building and advising startups and small businesses, Allan has helped more than 10,000 business owners navigate financing decisions, growth opportunities, and changing economic conditions. He earned a Bachelor of Science in Economics and an MBA with a concentration in Finance from Northeastern University, as well as a Juris Doctor from New England Law, where his studies focused on contracts and business law. His writing draws on extensive practical experience in small-business lending, equipment financing, business credit, and commercial finance.