
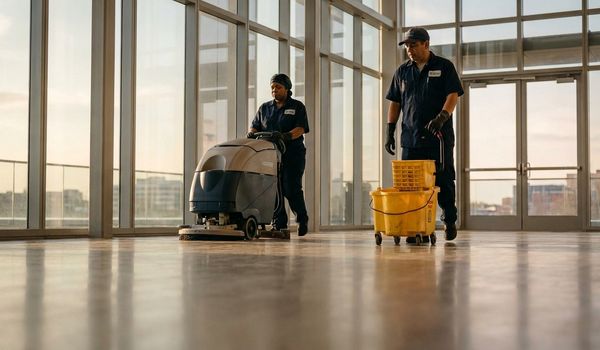
Cleaning industry statistics tell a remarkably consistent story: commercial cleaning is one of the most durable, quietly essential service sectors in the American economy. The U.S. janitorial services market generates close to $98 billion in annual revenue, supports well over one million individual businesses, and employs roughly 2.2 million janitors and building cleaners nationwide. Yet despite its size, the industry remains highly fragmented, which means opportunity for independent operators, franchise owners, and investors who understand where the numbers are pointing.
Whether you own a cleaning company, manage facilities, or are evaluating the sector as a business opportunity, current data matters. This report compiles the most important commercial cleaning statistics for 2026, drawing on figures from the U.S. Census Bureau, the Bureau of Labor Statistics, the Small Business Administration, and leading industry research firms. You will find market size estimates, growth projections, employment data, pricing benchmarks, demand drivers, and the trends most likely to shape the industry through the rest of the decade.
In This Article
- The Commercial Cleaning Industry at a Glance
- Commercial Cleaning Market Size and Growth
- Employment and Business Count Statistics
- Revenue and Pricing Benchmarks
- What Is Driving Demand in 2026
- Industry Segmentation by Service Type
- Key Commercial Cleaning Trends for 2026
- What These Statistics Mean for Cleaning Business Owners
- How Crestmont Capital Helps Cleaning Businesses Grow
- Real-World Scenarios: Putting the Data to Work
- Frequently Asked Questions
- How to Get Started
The Commercial Cleaning Industry at a Glance
Commercial cleaning, formally classified by the Census Bureau under NAICS code 561720 (Janitorial Services), covers the contract cleaning of non-residential buildings and facilities. That includes office buildings, medical facilities, schools, retail centers, industrial plants, warehouses, government buildings, and multi-tenant commercial properties. Services typically range from nightly janitorial work and restroom sanitation to floor care, carpet cleaning, window washing, pressure washing, and post-construction cleanup.
The industry operates on a simple but powerful economic model: recurring contracts. Most commercial cleaning revenue is generated through monthly or annual service agreements, which gives established operators predictable, repeatable cash flow. That recurring-revenue profile is one reason lenders view established cleaning companies favorably compared with project-based businesses.
Structurally, the industry divides into three tiers. At the top sit national and international facility services firms, including companies like ABM Industries and ISS, which handle large institutional accounts. The middle tier consists of regional operators and franchise systems such as Jan-Pro, Coverall, and Anago, which combine brand recognition with local ownership. The bottom tier, by far the largest by business count, consists of hundreds of thousands of independent local operators, many employing fewer than ten people.
One defining characteristic surfaced clearly in 2020: commercial cleaning is an essential service. While many service sectors contracted sharply during the pandemic, demand for professional disinfection and sanitation surged. That resilience, documented in Census Bureau County Business Patterns data, has continued to support above-average interest in the sector from entrepreneurs and acquirers alike.
Commercial Cleaning Market Size and Growth
The headline figure most analysts cite for the U.S. commercial cleaning market is striking for a sector many people never think about. Industry research firm IBISWorld estimates that U.S. janitorial services revenue reached approximately $98 billion in 2024, making it one of the largest contract service categories in the country. That figure covers general janitorial work, floor and carpet care, window cleaning, and related building maintenance services delivered under contract.
Globally, the picture is even larger. Market research firms including Grand View Research and Fortune Business Insights place the worldwide cleaning services market between $370 billion and $430 billion in the mid-2020s, with projections approaching or exceeding $500 billion by 2030. That implies a compound annual growth rate of roughly 6 percent, comfortably ahead of general economic growth in most developed markets.
Within the United States, growth has run at roughly 3 to 5 percent annually over the past several years, with a distinct pandemic-era surge in 2020 and 2021 followed by normalization. Importantly, the normalization did not reverse the gains. Heightened expectations around workplace hygiene, indoor air quality, and visible cleaning presence have proven durable, effectively resetting the baseline for what building occupants and employees expect from facility operators.
Key Stat: The U.S. janitorial services market generates approximately $98 billion per year, and the global cleaning services market is projected to surpass $500 billion by 2030, a compound annual growth rate near 6 percent.
For business owners, the growth figures matter less in isolation than in combination with the industry's fragmentation. A $98 billion market with no dominant national player controlling even 5 percent share is a market where well-run local operators can still win contracts, expand routes, and build genuinely valuable businesses. That combination of scale and fragmentation is unusual, and it is the single most important structural fact in commercial cleaning.
Ready to Grow Your Cleaning Business?
Fast, flexible financing from the #1 business lender in the U.S. helps cleaning companies win bigger contracts. No obligation, apply in minutes.
Apply Now →Employment and Business Count Statistics
The commercial cleaning industry is one of the largest employers among contract service sectors. According to the Bureau of Labor Statistics, roughly 2.2 million people work as janitors and building cleaners in the United States. When maids, housekeeping cleaners, and supervisory staff in building services are included, total employment connected to the cleaning sector runs considerably higher.
On the business side, IBISWorld counts more than one million janitorial services businesses operating in the United States. That number reflects the industry's low barriers to entry: a new operator can launch with basic equipment, a vehicle, and a single contract. It also reflects the industry's defining structural feature, fragmentation. The overwhelming majority of cleaning businesses are small, locally owned operations with fewer than ten employees. Data from the Census Bureau Annual Business Survey consistently shows cleaning and janitorial firms among the most common business types owned by first-time entrepreneurs, including a notably high share of minority- and immigrant-owned businesses.
Employment in the sector is projected to keep growing at roughly 2 to 4 percent through the early 2030s, in line with or slightly ahead of the average for all occupations. More significant than the growth rate is the replacement demand: the Bureau of Labor Statistics projects hundreds of thousands of job openings per year for janitors and building cleaners, driven largely by turnover and retirements rather than new position creation alone.
That leads to one of the industry's most cited pain points. Annual turnover in janitorial work frequently exceeds 75 percent, and some operators report rates above 100 percent, meaning they effectively replace their entire frontline workforce every year. Wages have responded accordingly. Median pay for janitors and building cleaners now sits near $35,000 per year, and hourly rates in competitive metro markets have moved well above $16 to $17 as operators fight for reliable staff. For owners, labor is simultaneously the largest expense line and the biggest operational constraint on growth.
Revenue and Pricing Benchmarks
Revenue in commercial cleaning scales with contract count and facility size rather than headcount alone, which makes benchmarks especially useful for owners evaluating their own performance. While figures vary by market and service mix, industry surveys and operator data support the following general benchmarks:
- Solo operators and very small teams: $50,000 to $150,000 in annual revenue, typically built on a handful of small office or retail accounts.
- Small established operators: $150,000 to $500,000 per year, usually with one or two crews and a mix of nightly janitorial contracts and periodic services.
- Mid-size regional companies: $500,000 to $5 million per year, with dedicated supervisors, sales staff, and multi-site commercial accounts.
- Large regional and national firms: $5 million and up, often serving institutional clients such as hospitals, universities, and airport authorities.
Pricing is most commonly quoted per square foot per month. Standard office janitorial service typically runs between $0.05 and $0.25 per square foot depending on frequency, scope, and region. A small professional office of 2,000 to 5,000 square feet might pay $250 to $800 per month for nightly service, while a 50,000-square-foot facility can support contracts of $5,000 to $10,000 or more per month. Specialty services command premium pricing: medical terminal cleaning, industrial sanitation, and post-construction cleanup all bill at meaningfully higher rates than general janitorial work.
| Facility Type | Typical Monthly Contract Range | Pricing Notes |
|---|---|---|
| Small office (under 5,000 sq ft) | $250 to $800 | Nightly or 3x weekly service, standard scope |
| Mid-size office (5,000 to 25,000 sq ft) | $800 to $4,000 | Often includes day porter or restroom supply service |
| Large commercial (25,000+ sq ft) | $4,000 to $15,000+ | Multi-crew sites, supervisory staffing required |
| Medical and healthcare facilities | Premium of 25% to 50% above office rates | Terminal cleaning protocols, compliance documentation |
| Post-construction cleanup | Project-based, $0.10 to $0.50 per sq ft | One-time revenue, strong margin when managed well |
On profitability, well-run cleaning companies typically operate at gross margins of 30 to 50 percent and net margins of 10 to 15 percent once fully loaded labor, supplies, insurance, and overhead are accounted for. Operators who win larger contracts and spread supervision costs across multiple sites tend to land at the higher end of those ranges.
What Is Driving Demand in 2026
Several forces are converging to keep commercial cleaning demand resilient heading into 2026, and each is visible in the data.
Stabilizing office occupancy. Return-to-office patterns have settled into hybrid norms rather than collapsing, and employers increasingly treat visible cleanliness as part of the employee experience that justifies commuting. Daytime cleaning, once rare because crews worked overnight, has expanded precisely because occupants now expect to see cleaning happening.
Healthcare expansion. An aging population is driving construction of medical offices, outpatient centers, urgent care clinics, and senior living facilities, all of which require specialized, compliance-driven cleaning. Healthcare is consistently cited as one of the fastest-growing end markets for contract cleaning, and the premium pricing in that segment rewards operators who invest in training and certification.
Durable hygiene expectations. The pandemic permanently raised the baseline. Facility surveys continue to show that employees and tenants rank restroom cleanliness, disinfection of high-touch surfaces, and indoor air quality among their top facility priorities. Certification programs such as GBAC STAR, launched by the worldwide cleaning industry association ISSA, moved from niche to mainstream and remain a differentiator in competitive bids.
Outsourcing momentum. Building owners continue shifting from in-house janitorial staff to contracted services, transferring staffing, training, insurance, and compliance burdens to specialists. Census business data shows contract cleaning growing faster than overall building employment over the long run, a structural tailwind that favors independent operators.
Pro Tip: Healthcare and medical office cleaning contracts routinely command 25 to 50 percent price premiums over standard office work. Operators who invest in compliance training and certification can reposition a general janitorial business into this higher-margin segment.
Industry Segmentation by Service Type
Commercial cleaning is not one market but several overlapping ones, and the mix matters for anyone sizing an opportunity. General nightly janitorial service remains the largest segment, accounting for roughly 40 percent of industry revenue. The remainder splits among floor and carpet care, window and exterior cleaning, specialty services, and a fast-growing green cleaning category.
| Service Segment | Approximate Share of Revenue | Growth Outlook |
|---|---|---|
| General janitorial (nightly contract cleaning) | ~40% | Steady, tracks building occupancy |
| Floor and carpet care | ~20% | Strong, driven by equipment automation |
| Specialty and medical cleaning | ~15% | Fastest growing, premium pricing |
| Window and exterior cleaning | ~10% | Moderate, seasonal in northern markets |
| Post-construction and one-time services | ~10% | Cyclical, follows construction activity |
| Green and sustainable cleaning programs | ~5% and rising | Rapid, client-request driven |
Two segmentation facts stand out for operators. First, specialty services are growing faster than general janitorial work, which rewards companies that build certifications and documented protocols. Second, green cleaning, once a marketing checkbox, is now a genuine procurement criterion: industry surveys suggest roughly one in three commercial clients now requests green-certified products or processes in bids, and that share rises sharply among institutional and government buyers.
By the Numbers
Commercial Cleaning Industry, Key Statistics for 2026
$98B
Annual U.S. janitorial services revenue (IBISWorld estimate)
1M+
Janitorial services businesses operating in the United States
2.2M
Janitors and building cleaners employed nationwide (BLS)
~6%
Projected global cleaning services CAGR through 2030
Key Commercial Cleaning Trends for 2026
Automation is moving from novelty to standard equipment. Autonomous floor scrubbers and robotic vacuums have crossed the reliability threshold for large-footprint facilities. Market researchers project the commercial cleaning robot segment to grow at 20 percent or more annually through the late 2020s, and early adopters report meaningful labor-hour savings on floor care, the single most time-intensive task in most contracts. For operators, the constraint is capital: a single commercial robotic scrubber can run $20,000 to $50,000, which is precisely the kind of productivity investment equipment financing exists to support.
Data and verification are becoming bid requirements. IoT-enabled dispensers, QR-coded inspection checkpoints, and workforce management apps now let operators prove service delivery rather than simply promise it. Institutional buyers increasingly expect digital reporting, and operators who can produce it win renewals at higher rates.
Green cleaning is now a procurement criterion. As noted above, roughly a third of commercial clients request environmentally certified products and processes. The green cleaning products market itself is projected to approach $11 billion globally by the end of the decade, and certification frameworks give smaller operators a credible way to differentiate without competing on price alone.
Consolidation is accelerating. Private equity interest in recurring-revenue service businesses has reached commercial cleaning, with regional roll-ups active across the Sun Belt and Midwest. For established owners, that creates two-sided opportunity: well-documented operators can sell at attractive multiples, while growth-minded operators can acquire routes and accounts from retiring owners, often with seller financing or acquisition loans.
Key Stat: The commercial cleaning robot segment is projected to grow at roughly 20 percent annually through the late 2020s, as autonomous floor care crosses from early adoption into standard practice for large facilities.
What These Statistics Mean for Cleaning Business Owners
Data only matters if it changes decisions. Four conclusions follow directly from the numbers above.
First, the market is large, growing, and open. A $98 billion U.S. market with over a million competitors sounds crowded until you realize that fragmentation means no competitor is entrenched at scale. Contracts turn over regularly, facility managers rebid services, and quality operators take share. The barrier is not market access; it is execution capacity.
Second, labor is the binding constraint. With turnover rates that can exceed 75 percent annually, the operators who grow are the ones who systematize recruiting, training, and retention. Budgeting for wage competitiveness is not optional in 2026; it is the cost of being able to say yes to new contracts.
Third, capital unlocks scale. Almost every growth lever in this industry requires money before it produces revenue: hiring crews ahead of a new contract start date, buying floor equipment and vehicles, funding payroll through a client's 30 to 60 day payment terms, or acquiring a competitor's book of business. Operators with access to working capital and equipment financing consistently outgrow operators who self-fund from cash flow alone.
Fourth, specialization pays. The pricing data is unambiguous: medical, industrial, and green-certified cleaning commands premiums of 25 to 50 percent over commodity janitorial rates. Investing in training and certification is one of the highest-return moves a small operator can make.
How Crestmont Capital Helps Cleaning Businesses Grow
Crestmont Capital works with cleaning and janitorial companies at every stage, from first-contract startups to multi-crew regional operators, and the financing products map directly onto the growth scenarios the statistics describe.
For day-to-day cash flow, a business line of credit smooths the gap between payroll and client payment cycles, which matters when a single new contract can add dozens of labor hours weeks before the first invoice is paid. For automation investments, equipment financing lets operators acquire floor scrubbers, carpet extractors, and vehicles with fixed monthly payments instead of large upfront outlays.
For larger moves, such as acquiring a competitor's routes or funding a multi-site expansion, small business financing provides term funding sized to the opportunity. Crestmont has covered the cleaning sector extensively, and owners looking for a deeper dive can read our guides on commercial cleaning business loans and financing options for janitorial and cleaning companies for qualification details and product comparisons.
Because cleaning revenue is contract-based and recurring, established operators often qualify for better terms than their balance sheets alone would suggest. Lenders who understand the industry read contract portfolios as the assets they are.
Win Bigger Cleaning Contracts
Fund new hires, equipment, and expansion before the first invoice clears. Crestmont Capital moves at the speed of your next opportunity.
Get Funded →Real-World Scenarios: Putting the Data to Work
Statistics become useful when they inform real decisions. Here are four scenarios that show how cleaning business owners apply this market data in practice.
Scenario 1: The first big contract. A two-person operation in Atlanta lands a contract to clean a 30,000-square-foot medical office building, its largest account by a factor of three. The contract pays $4,200 per month, a fair price given the healthcare premium documented in the pricing data, but it requires hiring four part-time cleaners immediately while the client's payment terms are net 45. The owner draws on a business line of credit to cover roughly $14,000 in payroll and supplies over the first two months, then repays it as invoices clear. The data point that mattered: medical contracts command premium pricing, which justified the financing cost many times over.
Scenario 2: Automating floor care. A regional operator in Ohio services 400,000 square feet of warehouse and light industrial space nightly. Floor care consumes nearly half of all labor hours. After reviewing the automation trend data, the owner finances two autonomous floor scrubbers for approximately $70,000 total, cutting floor-care labor hours by about a third. The machines paid for themselves in under eighteen months through redeployed labor, and the operator now bids large-footprint contracts competitors cannot staff.
Scenario 3: Acquiring a route. A retiring owner in Phoenix offers his book of 22 recurring office contracts, generating $38,000 in monthly revenue, to a younger competitor for $285,000. With industry consolidation accelerating, the buyer uses an acquisition-focused term loan rather than depleting operating cash. The acquired contracts produce enough margin to service the debt from month one, and the buyer's company crosses the $1 million revenue threshold that unlocks larger commercial bids.
Scenario 4: Repositioning into specialty work. A general janitorial company in New Jersey notices that its three healthcare clients renew at higher rates and accept annual price increases without pushback, consistent with the segmentation data showing specialty cleaning as the fastest-growing category. The owner invests in GBAC-aligned training, bloodborne pathogen certification for supervisors, and documented terminal cleaning protocols. Within a year, healthcare accounts grow from 18 to 35 percent of revenue, at margins roughly 40 percent higher than the company's office contracts.
Frequently Asked Questions
How big is the commercial cleaning industry in the United States?+
The U.S. janitorial services market generates approximately $98 billion in annual revenue, according to IBISWorld estimates. More than one million individual cleaning businesses operate nationwide, and the sector employs roughly 2.2 million janitors and building cleaners, making it one of the largest contract service industries in the country.
How fast is the cleaning industry growing?+
U.S. janitorial services revenue has grown at roughly 3 to 5 percent annually in recent years. The global cleaning services market is projected to grow at a compound annual rate near 6 percent through 2030, approaching or exceeding $500 billion worldwide, driven by healthcare expansion, outsourcing, and elevated hygiene standards.
How many commercial cleaning businesses are there in the U.S.?+
Industry research counts more than one million janitorial services businesses in the United States. The vast majority are small, locally owned operations with fewer than ten employees, which is why the industry remains highly fragmented despite its overall size.
What is the average revenue for a small cleaning business?+
Solo operators and very small teams typically generate $50,000 to $150,000 per year. Small established operators with one or two crews commonly reach $150,000 to $500,000 annually, while mid-size regional companies range from $500,000 to $5 million. Revenue scales primarily with contract count and facility size rather than headcount alone.
What do commercial cleaning companies charge per square foot?+
Standard office janitorial service typically runs $0.05 to $0.25 per square foot per month, depending on service frequency, scope, and region. Specialty work such as medical terminal cleaning commands premiums of 25 to 50 percent above standard office rates, while post-construction cleanup bills at $0.10 to $0.50 per square foot on a project basis.
Is the cleaning industry recession resistant?+
Commercial cleaning has historically shown strong resilience because buildings must be cleaned regardless of economic conditions, and most revenue comes from recurring contracts. During the 2020 downturn, demand for professional disinfection actually increased. Budget pressure in recessions can compress margins, but contract cleaning volumes tend to hold up better than discretionary services.
What is the biggest challenge facing cleaning businesses in 2026?+
Labor. Annual turnover in janitorial work frequently exceeds 75 percent, and median wages have risen to roughly $35,000 per year as operators compete for reliable staff. Companies that systematize recruiting, training, and retention, and that invest in automation to reduce labor hours per contract, are the ones positioned to grow.
How profitable are commercial cleaning companies?+
Well-run cleaning companies typically operate at gross margins of 30 to 50 percent and net margins of 10 to 15 percent after labor, supplies, insurance, and overhead. Operators with larger multi-site contracts and specialty service mix tend to land at the higher end of the range, while price-driven commodity work compresses margins.
Which cleaning services are growing fastest?+
Specialty and medical cleaning is the fastest-growing segment, driven by healthcare construction and compliance requirements. Green cleaning programs are also expanding rapidly, with roughly one in three commercial clients now requesting certified sustainable products or processes. Technology-enabled services with digital verification are winning share among institutional buyers.
How much does it cost to start a commercial cleaning business?+
Basic startup costs run from a few thousand dollars for a minimal setup to $50,000 or more for a properly equipped launch with a vehicle, commercial-grade equipment, insurance, bonding, and initial marketing. Most owners underestimate working capital: new contracts require payroll and supply spending weeks before the first client payment arrives.
Are cleaning robots actually replacing janitorial workers?+
Not replacing, redeploying. Autonomous floor scrubbers handle the most repetitive, time-intensive tasks, freeing staff for detail work that machines cannot do. With turnover so high and hiring so difficult, most operators view automation as a way to cover labor shortages rather than eliminate positions. The commercial cleaning robot segment is growing at roughly 20 percent annually.
What financing options work best for cleaning companies?+
A business line of credit handles payroll timing gaps when new contracts start. Equipment financing covers scrubbers, extractors, and vehicles with fixed monthly payments. Term loans fund acquisitions of competitor routes or multi-site expansions. Because cleaning revenue is contract-based and recurring, established operators often qualify on the strength of their contract portfolios.
How do I win larger commercial cleaning contracts?+
Institutional buyers expect documented quality systems, proper insurance and bonding, digital service verification, and increasingly green or GBAC-aligned certifications. Demonstrating staffing depth matters most: facility managers award large contracts to operators who can prove they can absorb the labor requirement from day one, which is where working capital access becomes a competitive advantage.
Is green cleaning worth the investment?+
The data suggests yes. Roughly a third of commercial clients now request green-certified products or processes, with higher shares among institutional and government buyers. Certification and product costs are modest relative to the differentiation they create, and green positioning increasingly appears as a scoring criterion in formal procurement processes.
Where can I find official data on the cleaning industry?+
Primary sources include the U.S. Census Bureau (County Business Patterns and the Annual Business Survey, covering NAICS 561720), the Bureau of Labor Statistics Occupational Outlook Handbook for janitors and building cleaners, and the SBA business resource library. Private research firms such as IBISWorld, Grand View Research, and ISSA publish industry-specific market reports.
Put the Numbers to Work
The data says the opportunity is real. Crestmont Capital gives cleaning businesses the funding to act on it.
Check Your Options →How to Get Started
Complete our quick application at offers.crestmontcapital.com/apply-now in just a few minutes.
A Crestmont Capital advisor will review your contract portfolio and match you with the right financing option.
Receive your funds and put them to work on new contracts, equipment, and hires, often within days of approval.
Conclusion
The cleaning industry statistics heading into 2026 describe a sector that is large, growing, and structurally favorable to well-run independent operators. Nearly $98 billion in annual U.S. revenue, more than a million competing businesses, and no dominant national player means market share is won contract by contract, and the operators who win are the ones with the staffing, equipment, and working capital to say yes when opportunity appears.
The trends reward preparation: healthcare and specialty work paying premium rates, automation cutting labor hours, green certification opening institutional doors, and consolidation creating acquisition opportunities for growth-minded owners. None of these moves are free, but all of them are financeable. When you are ready to turn this market data into your growth plan, Crestmont Capital is ready to fund it.
Disclaimer: The information provided in this article is for general educational purposes only and is not financial, legal, or tax advice. Funding terms, qualifications, and product availability may vary and are subject to change without notice. Crestmont Capital does not guarantee approval, rates, or specific outcomes. For personalized information about your business funding options, contact our team directly.

Allan Garfinkle
Allan Garfinkle is the Chief Revenue Officer at Crestmont Capital, where he has spent more than a decade leading revenue strategy, business development, and operational growth. With 28 years of experience building and advising startups and small businesses, Allan has helped more than 10,000 business owners navigate financing decisions, growth opportunities, and changing economic conditions. He earned a Bachelor of Science in Economics and an MBA with a concentration in Finance from Northeastern University, as well as a Juris Doctor from New England Law, where his studies focused on contracts and business law. His writing draws on extensive practical experience in small-business lending, equipment financing, business credit, and commercial finance.